Infographics
Gallery of diagrams I made to explain various technical concepts
My role
Graphic Designer 0

01

Context

As a Content Developer, I’ve often used diagrams to help visualize challenging technical concepts.

This gallery showcases some of the more interesting ones.

02

CRM integrations

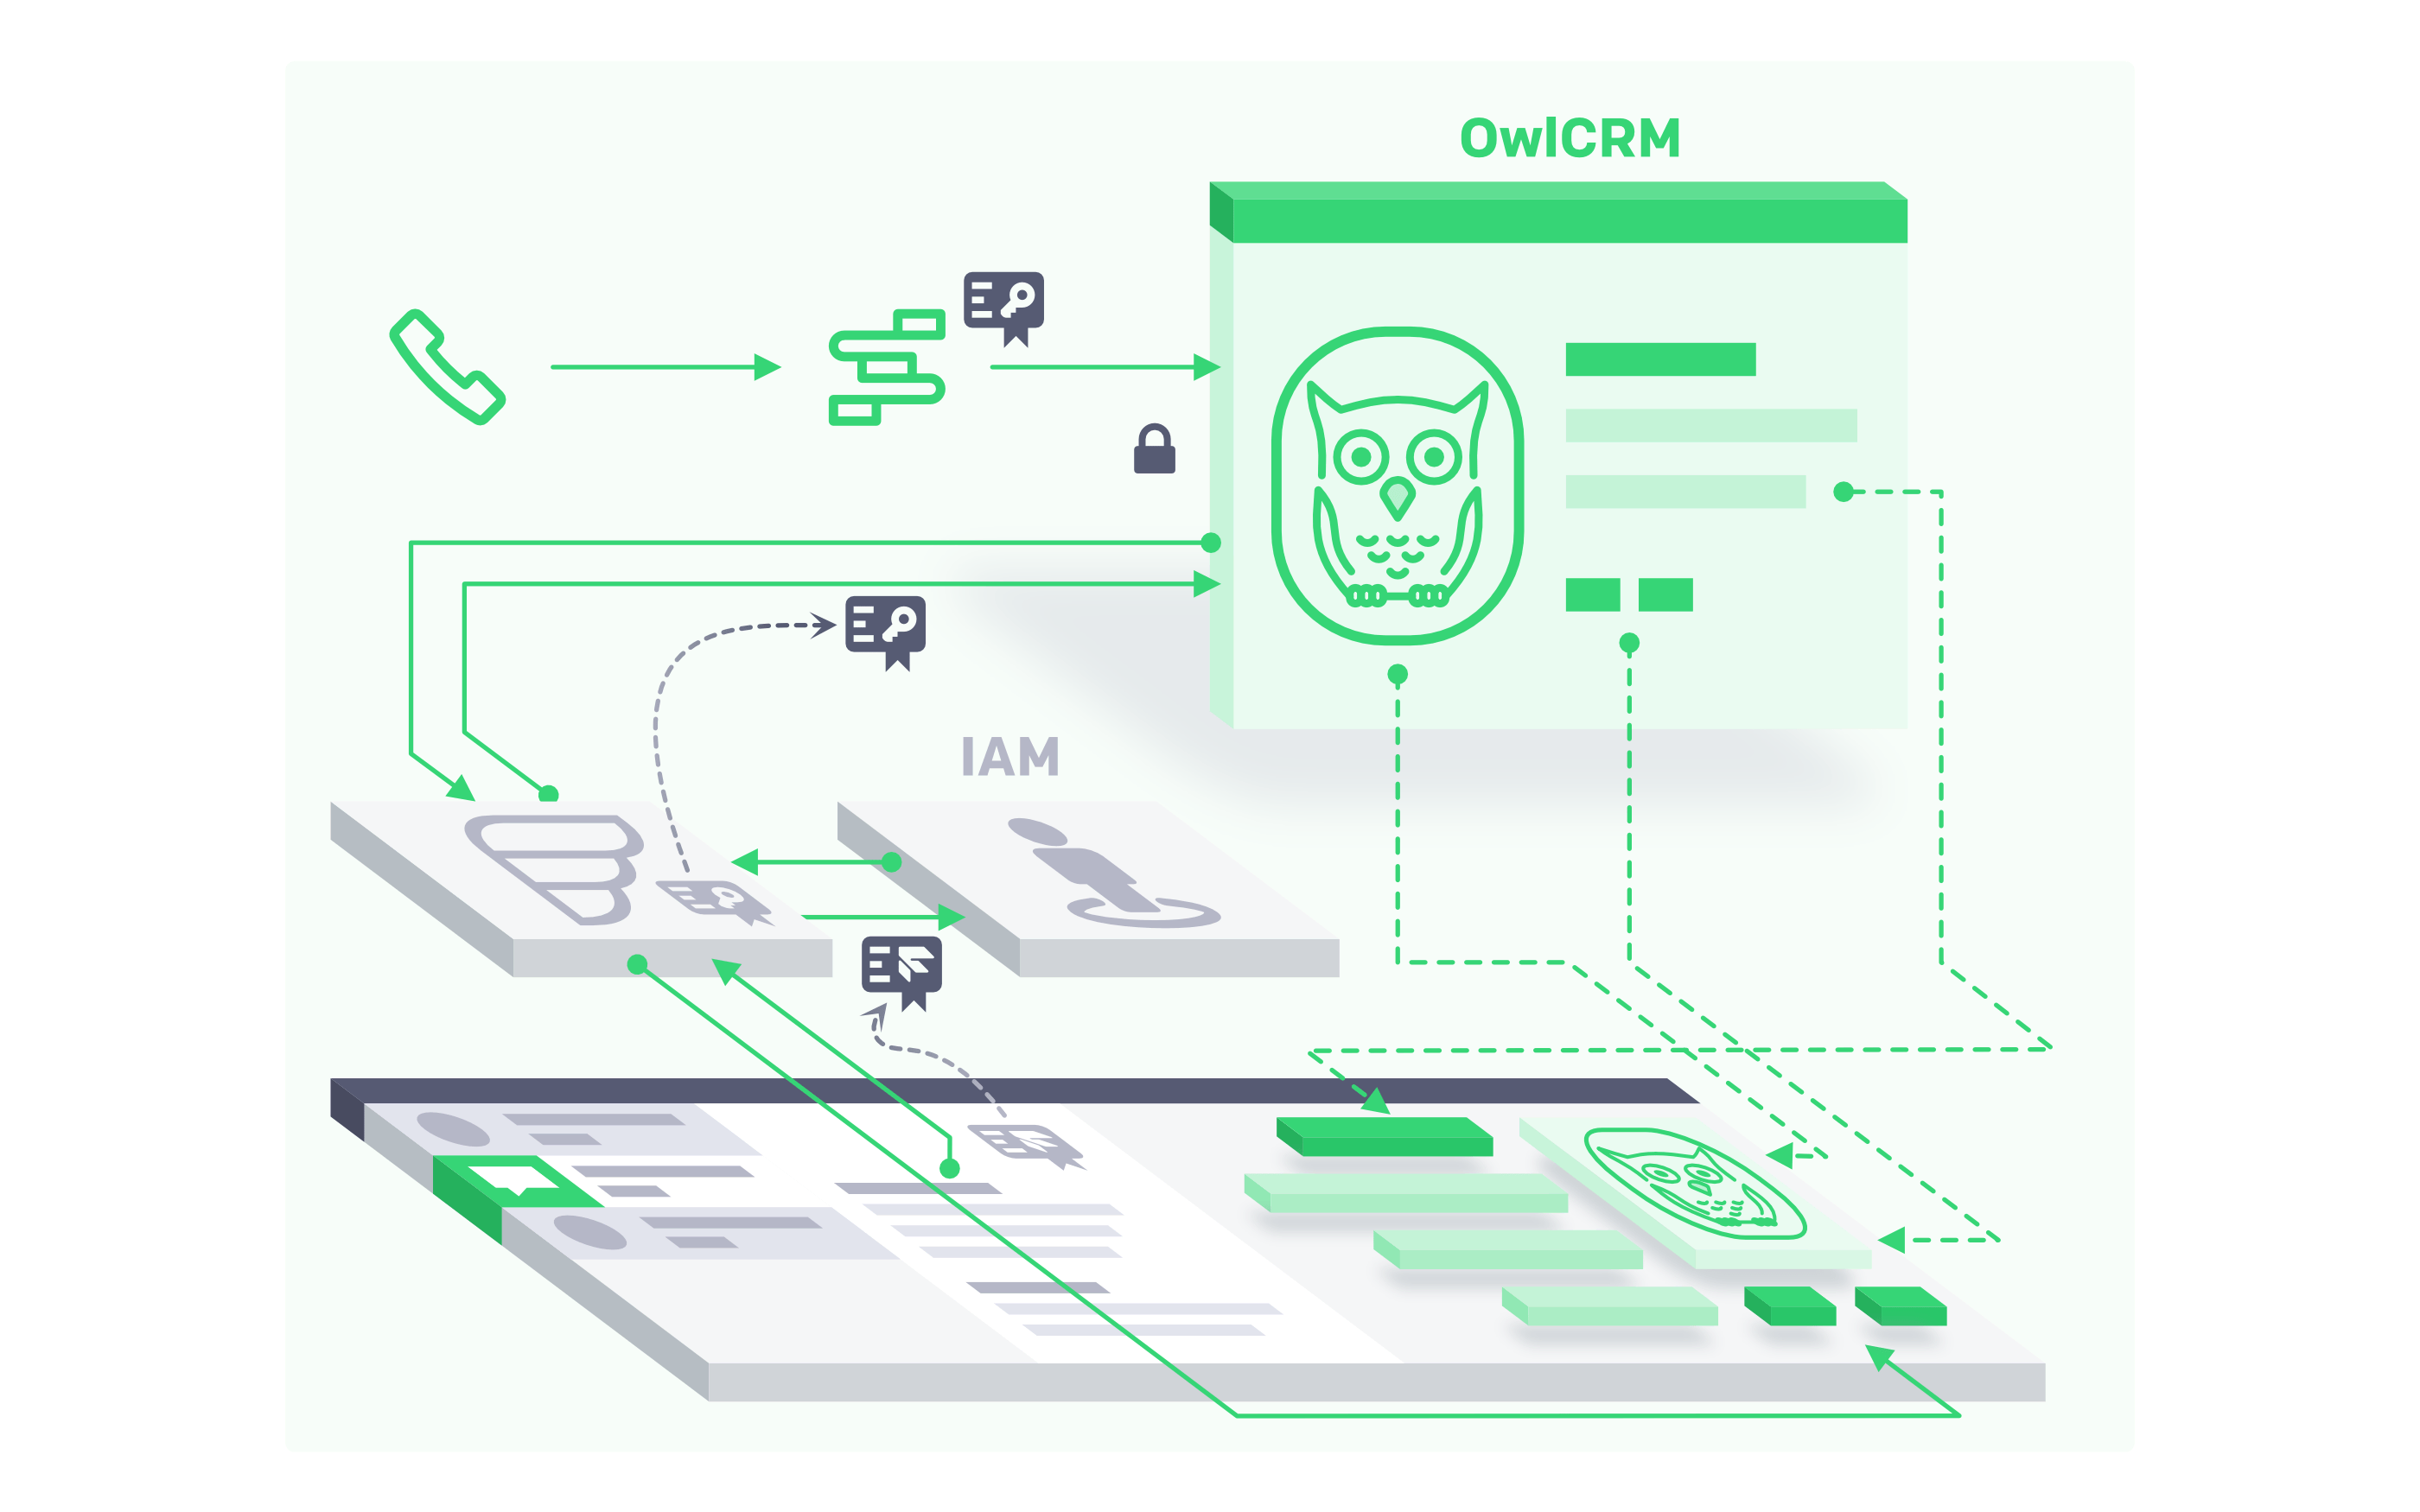
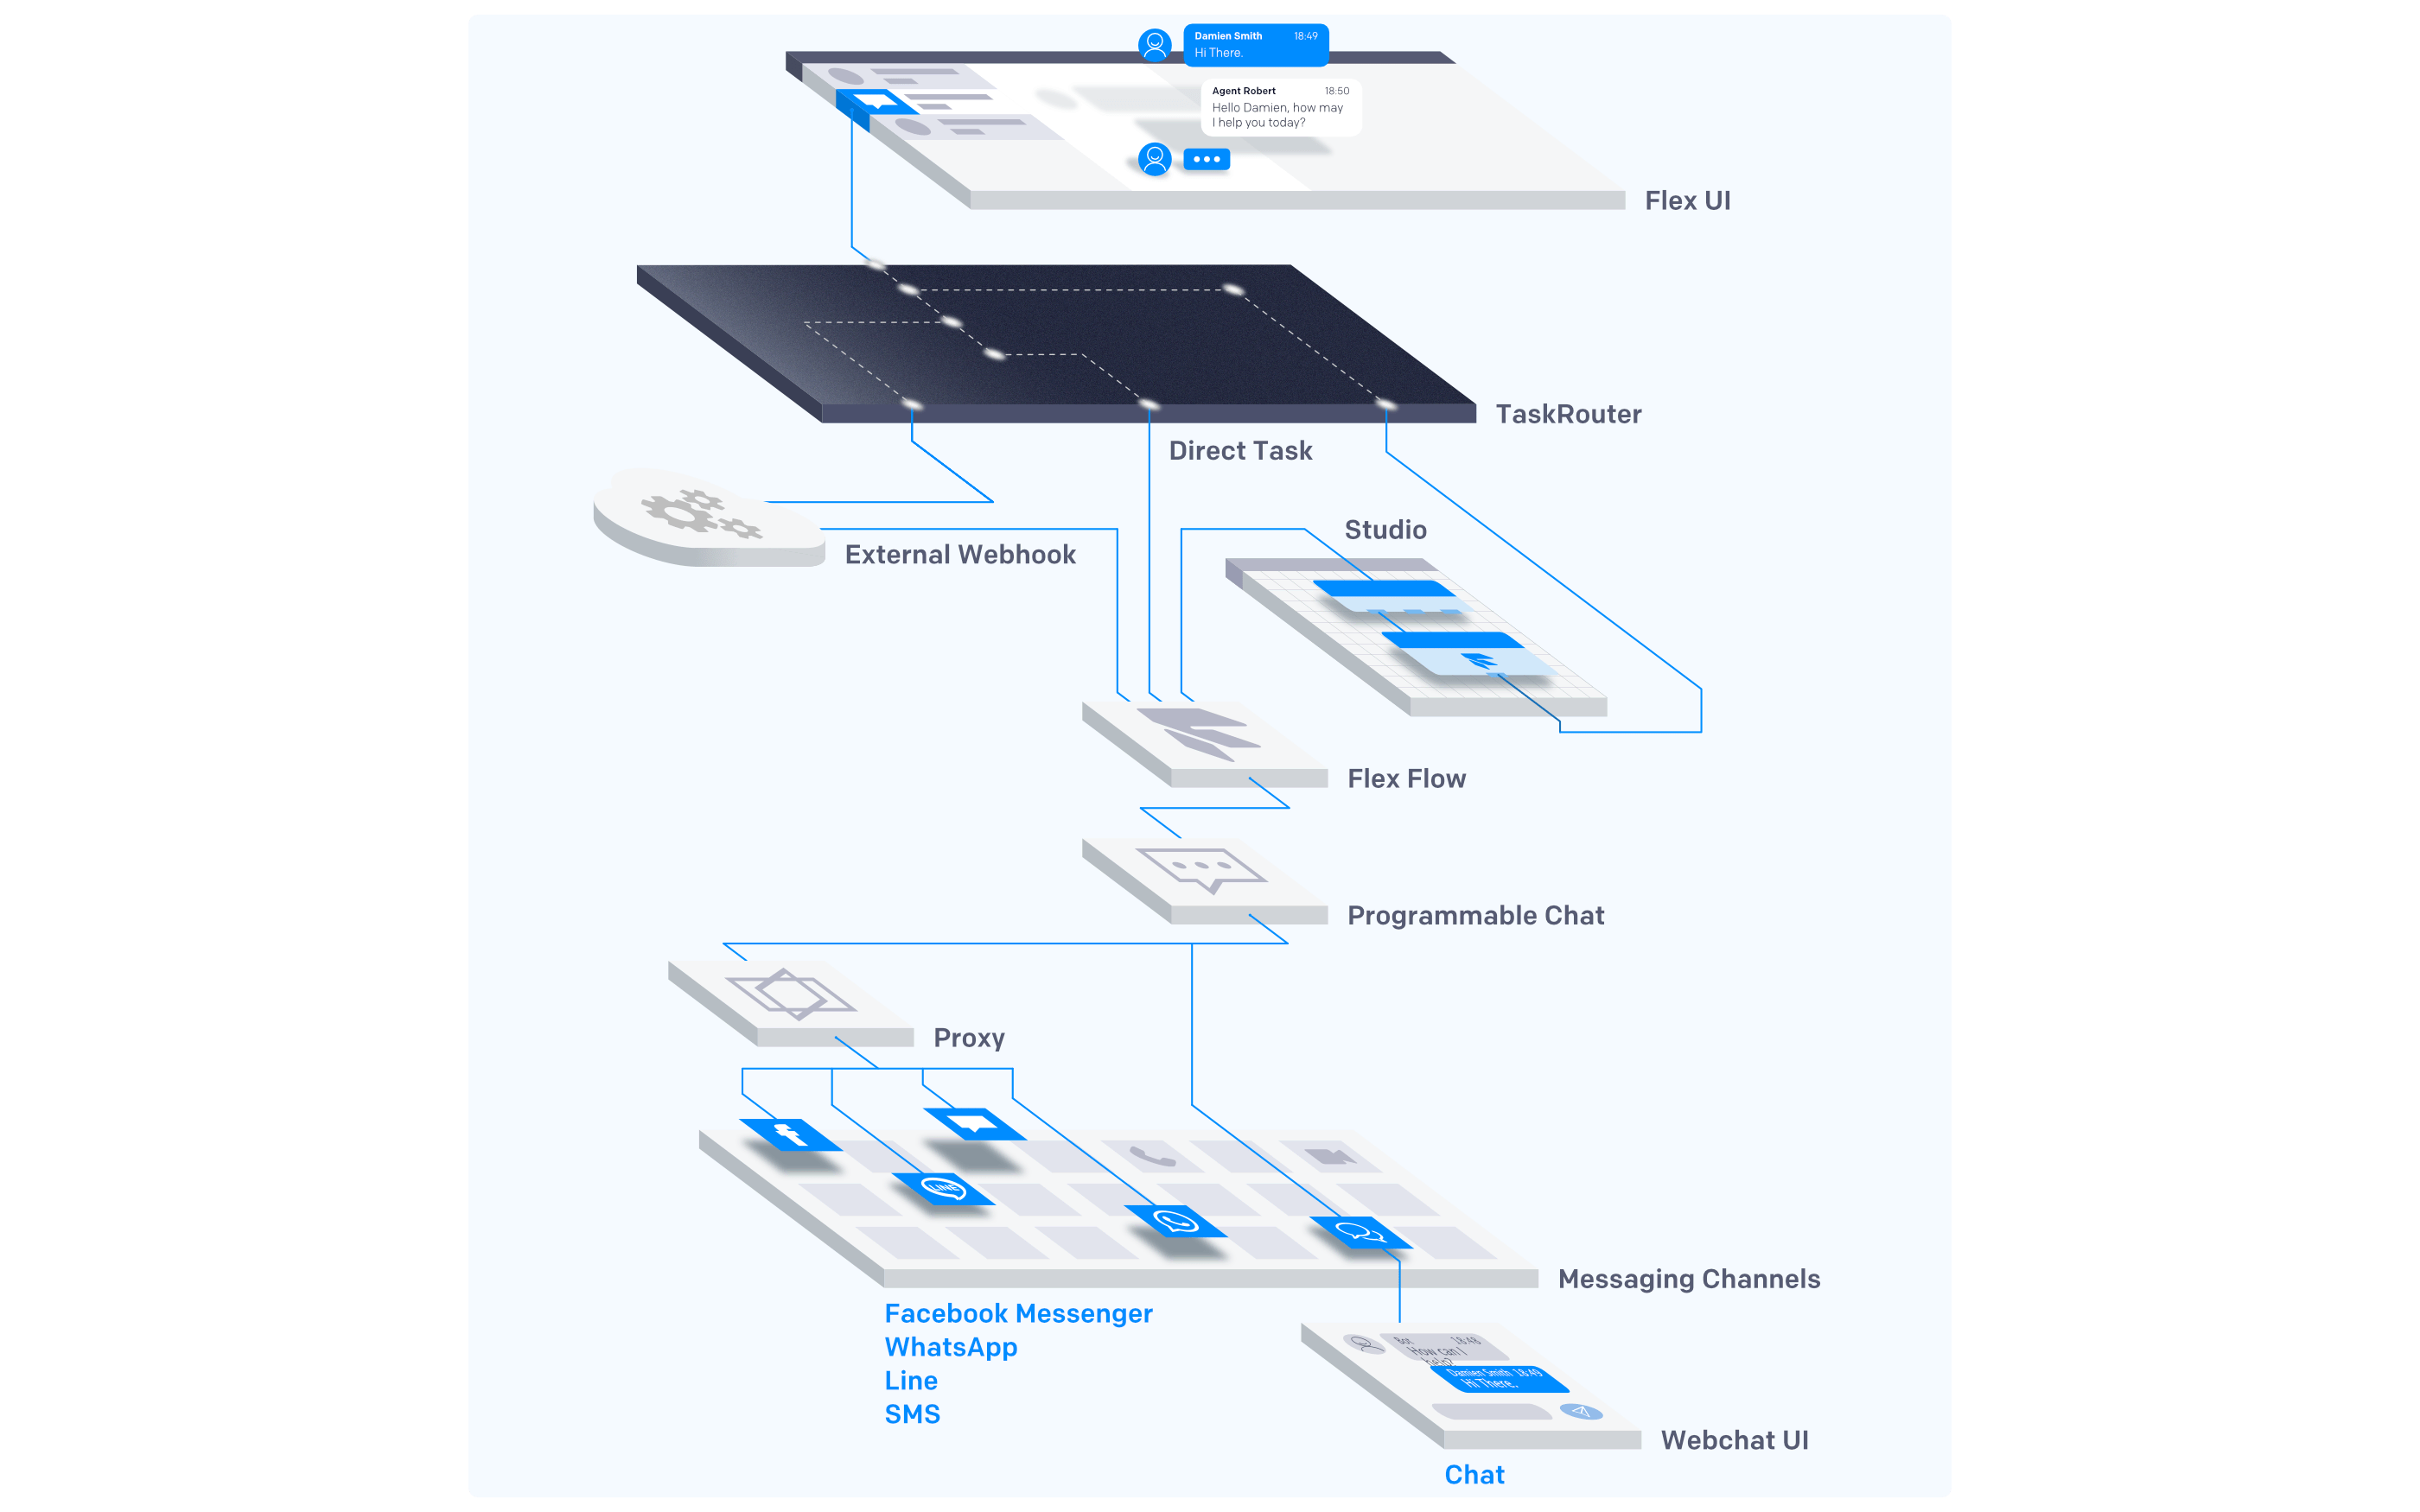
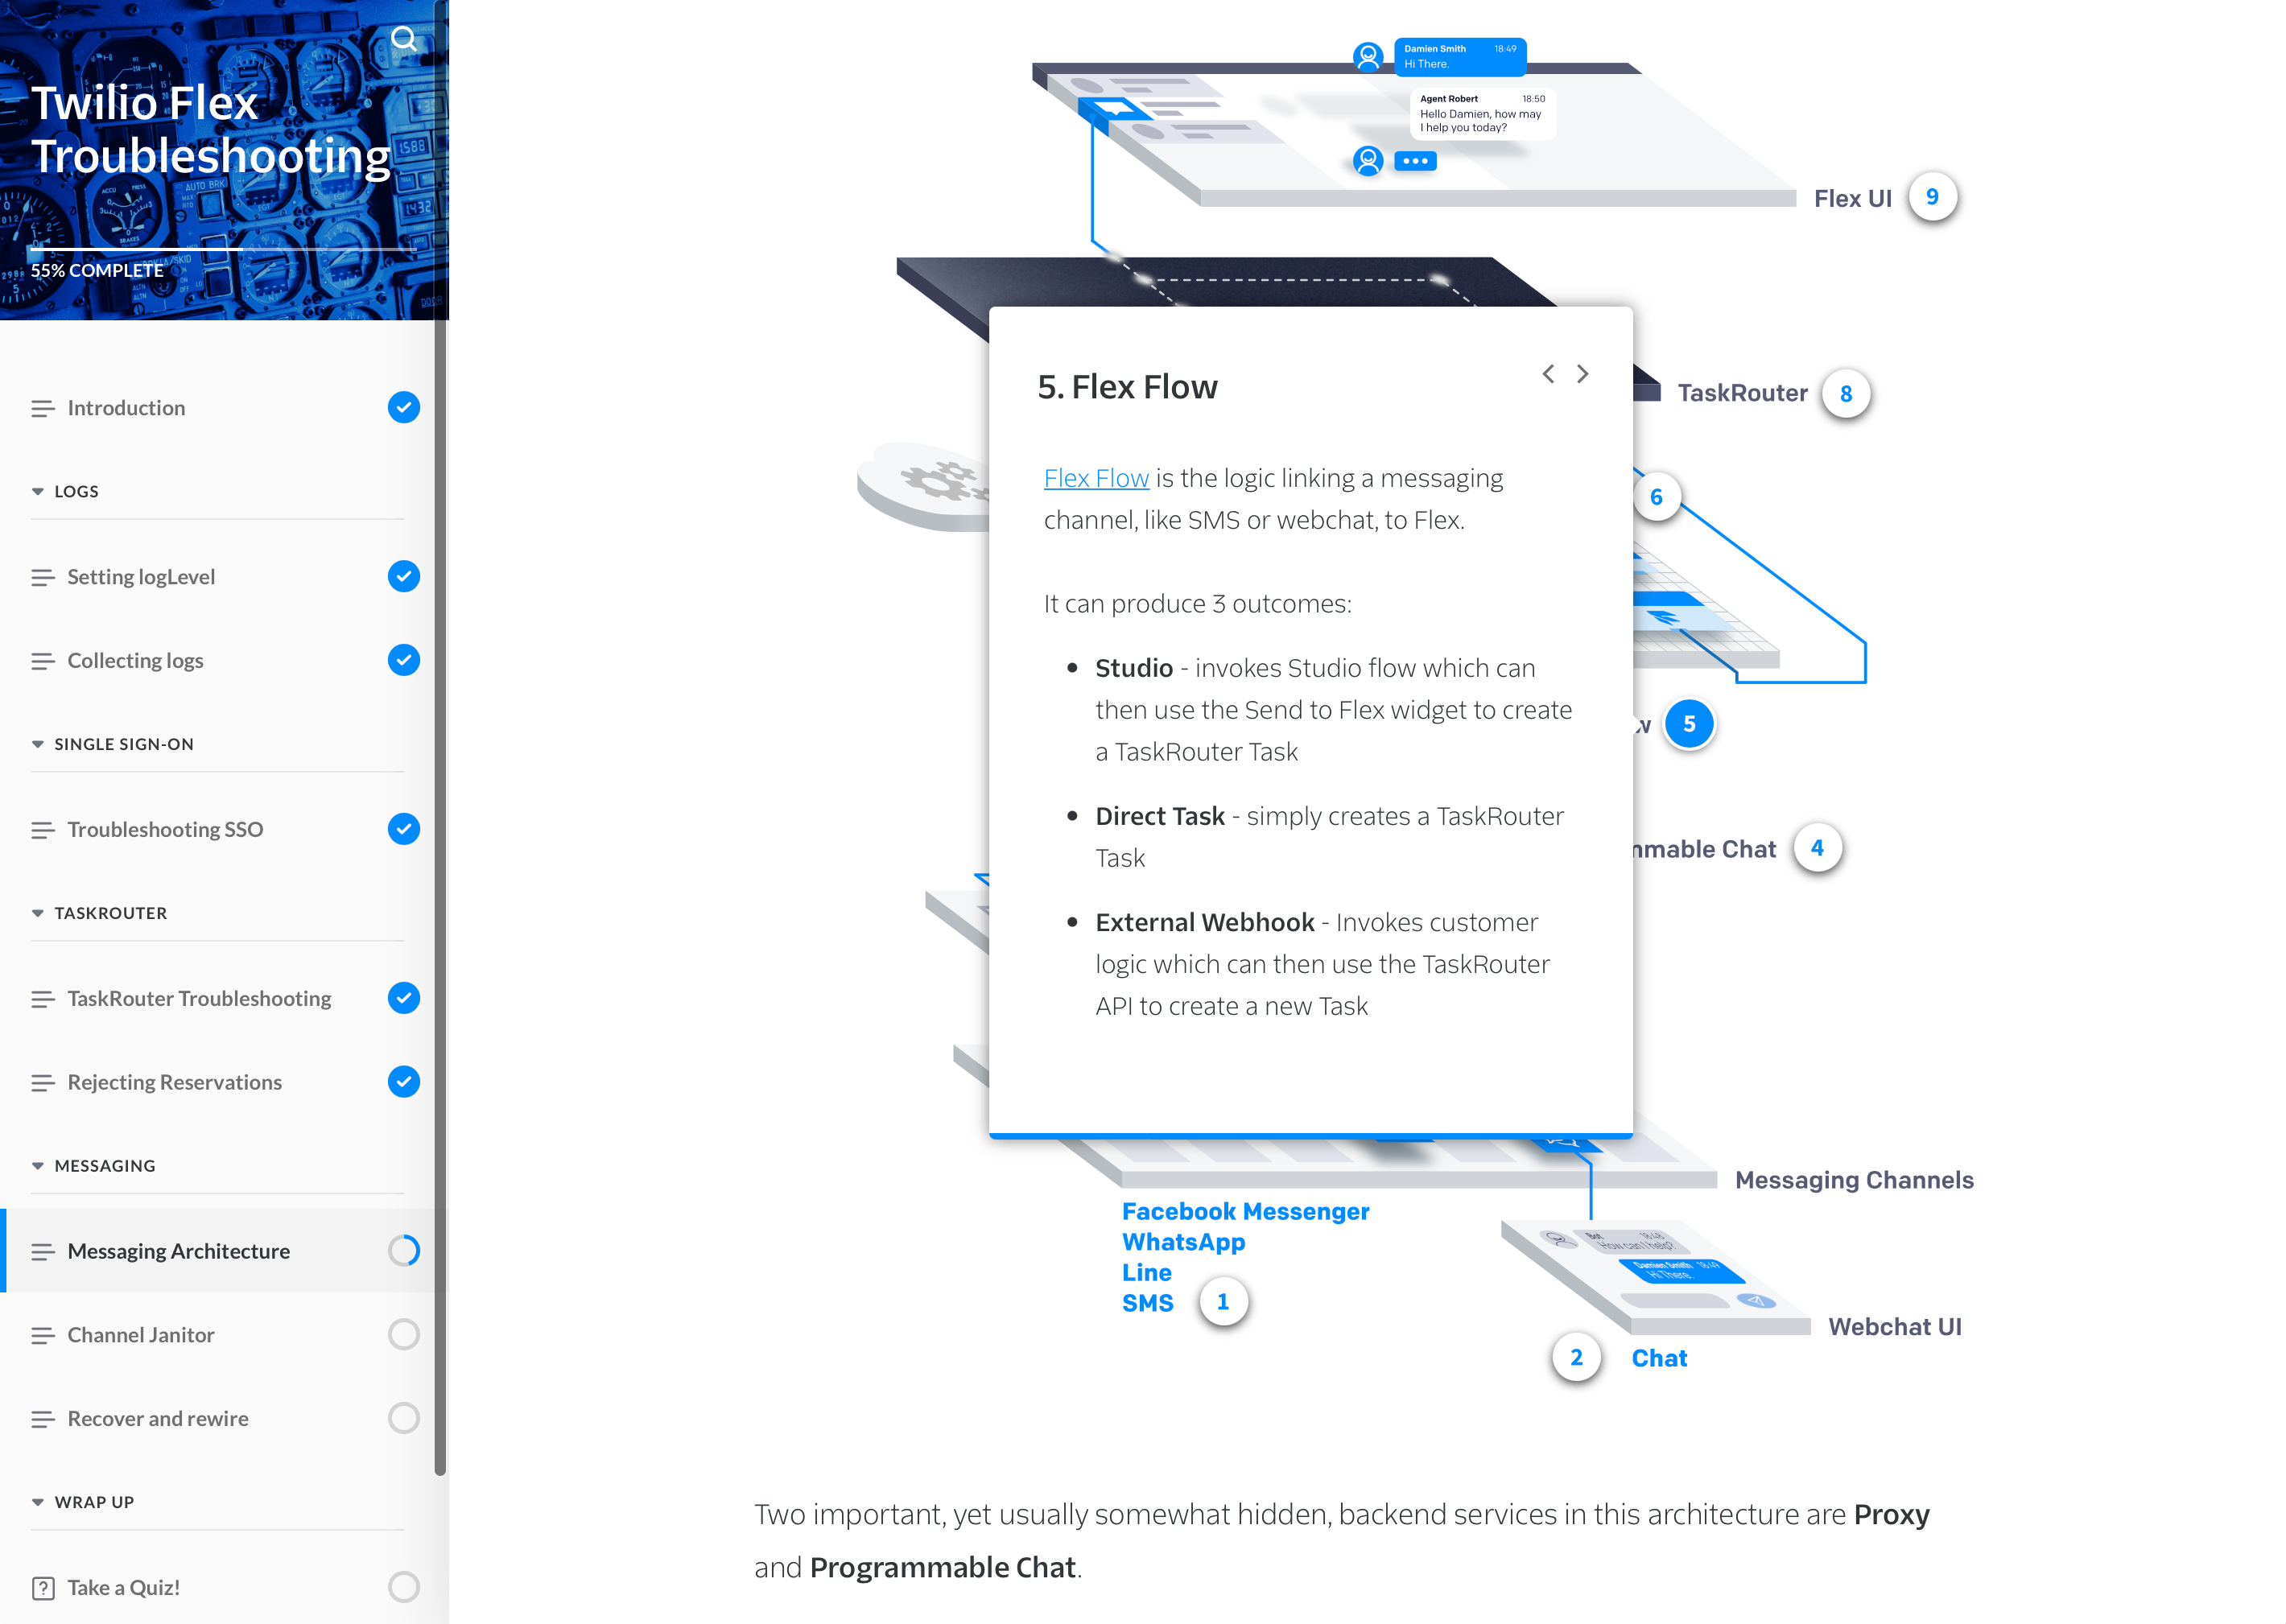
These diagrams were built for a series of contact center coding exercises across 3 courses. These courses walk learners through integrating Twilio Flex with 3 CRMs of increasing complexity.

I also built functional mocks of these 3 CRMs, learners then integrated to contact center with these mocks.

This was my first exploration of the use of isometric graphics for technical diagrams. Owl is Twilio’s mascot, hence the bird theme.

03

Product architecture

This diagram is part of the Twilio’s contact center troubleshooting course. It captures the complex multi-layered architecture of the messaging channels.

04

Flowcharts

A good way to explain complex concepts is to break them down into simpler ones.

In this instance, I did exactly that with a capstone voicemail application that learners built for an Advanced Voice course.

Terminal Player Widget

Top